

The Area
For most of the areas contained in the database only raster data is stored. Raster data contains the area meta information - the calculation parameters - and the naked iteration values per pixel. The browsing tool is able to map this info into viewable pictures on-the-fly.
Therefore two additional types of information are required: a colormap and a transformation method. The colormap describes an indexed set of RGB colors. And the transformation method describes how to map the iteration values of the raster data to color indices.
Both elements are handled by the browsing tool and can be changed on-the-fly. By default each sub area is shown with the same settings used for the parent. But the colormap can be changed at any time to any of the provided versions.
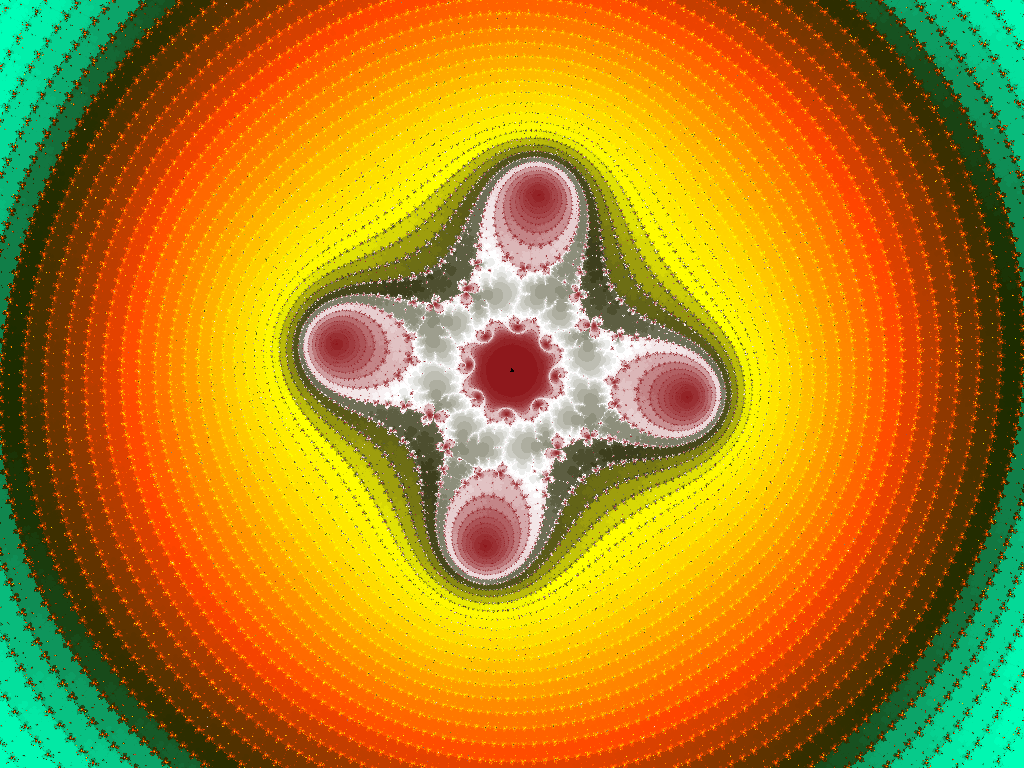
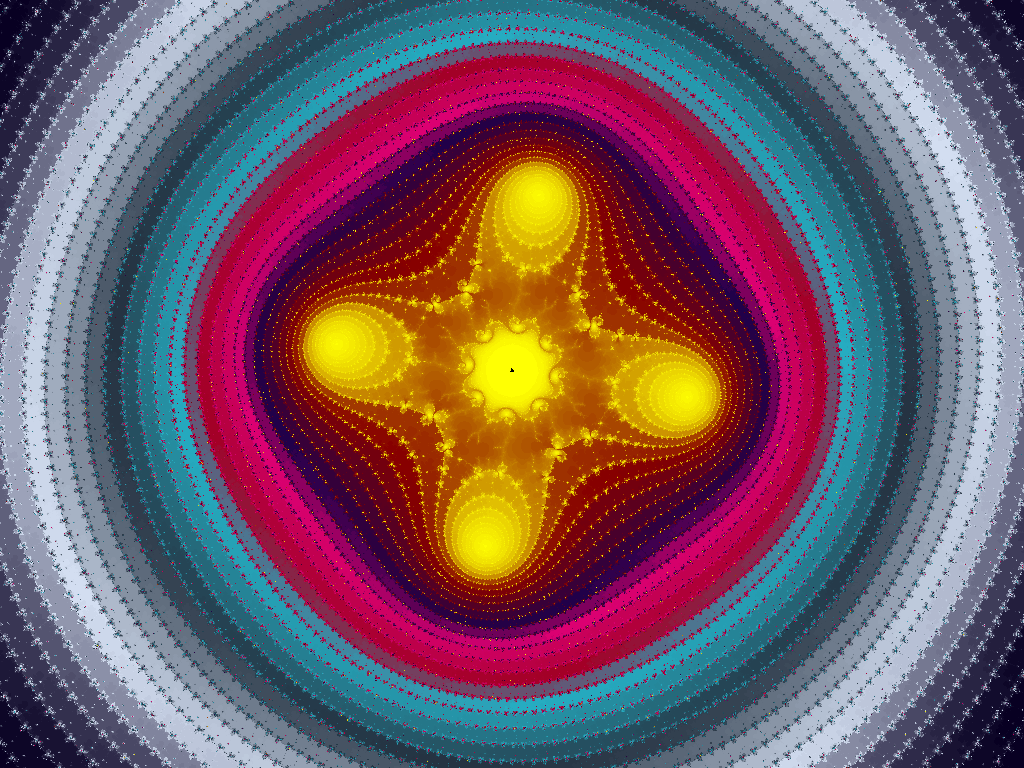
It is even possible to modify the colormap, to play arround with the visualization. Here is shown the same raster data with two different colormaps. The database povides several different colormaps that can freely be selected. The Web version does not allow to store own versions.
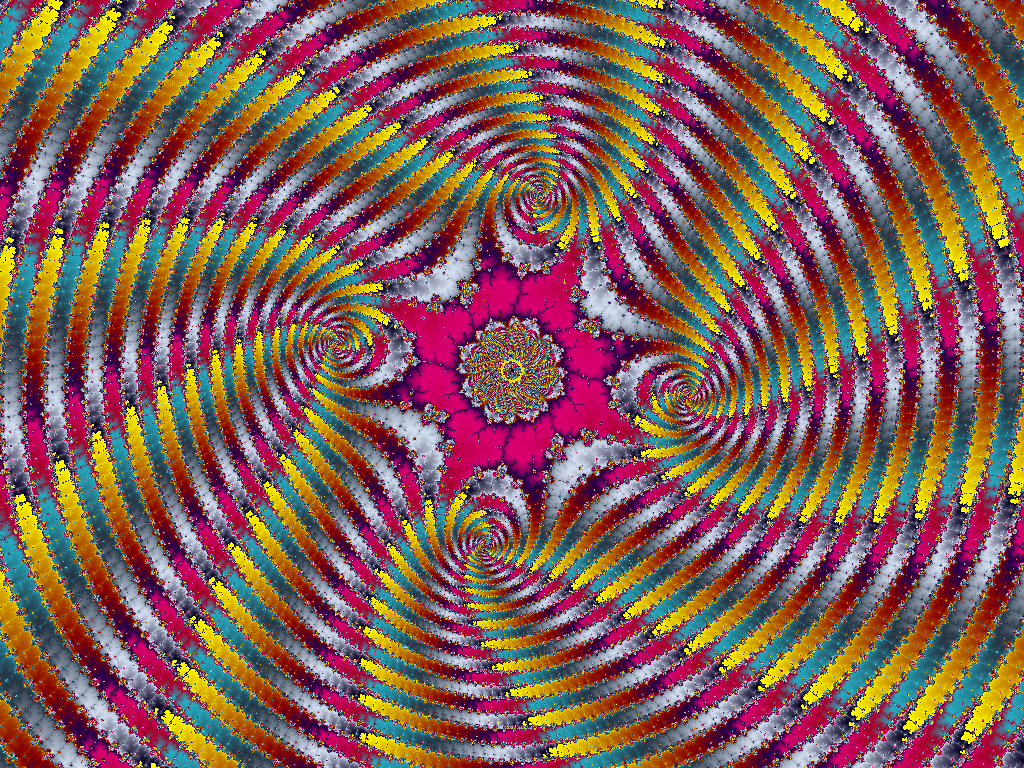
The second information is the mapping method. There are three different possibilites to choose. The same raster with the same colormap than the first one, but with a different color mapping method may look totally different.
For selected areas the database also contains the complete information to generate pictures, raster data, colormap and mapping. For those areas the currently used colormap will automatically be switched to the one stored together with the area data.